User Guide for the Electronic Single-Fiber Tensile Tester

In the fields of textile material research and development and quality control, the electronic single-fiber tensile tester is a specialized instrument used to measure the breaking strength and elongation at break of fibers. It is widely used for performance testing of materials such as cotton, wool, linen, silk, chemical fibers, and glass fibers. This document provides a systematic introduction to the instrument’s operating procedures, key parameter settings, and daily maintenance techniques.


I. Working Principle and Structural Overview


The electronic single-fiber strength tester is a constant rate of extension (CRE) tensile testing instrument. Its operating principle is as follows: a high-sensitivity sensor converts the force exerted on the fiber during stretching into an electrical signal. After amplification and analog-to-digital conversion, the breaking load value is displayed directly in digital form. Simultaneously, a stepper motor drives the lower grip to move at a constant speed, while a microprocessor records the number of pulses and performs a scaling transformation to calculate the fiber’s elongation at break in real time.


Modern electronic single-fiber tensile testers typically consist of three components: the main unit (including the force sensor, transmission mechanism, and grips), the operating control system (touchscreen panel or online software), and the data output module (printer or computer interface). Gripping methods include manual, pneumatic, and electric gripping. Among these, pneumatic gripping effectively reduces human interference, making testing more objective and efficient.


II. Preparations Before Testing


1. Checking the Environment and Instrument Condition


Testing should be conducted under standard atmospheric conditions, i.e., at a temperature of 20±2°C and a relative humidity of 65%±2%.

The following checks must be completed before the experiment:


- Use a spirit level to adjust the instrument base to ensure the entire unit is level and stable

- Clean dust from the workbench and instrument surfaces, paying particular attention to the test probes and sensor probe areas

- Check whether the jaws of the upper and lower clamps are flat and free of wear; replace the jaw spacers if necessary

- Confirm that the power supply voltage is stable at AC 220 V ± 10%, with a frequency of 50 Hz


2. Sample Pretreatment


Fiber samples must undergo moisture equilibration prior to testing. Place the sample in a standard atmospheric environment for at least 24 hours to allow it to reach moisture equilibrium. If the sample’s moisture regain exceeds the standard moisture regain, pre-conditioning must be performed first (at a temperature not exceeding 50°C and relative humidity of 10%–25%) before moisture equilibration.


When sampling, randomly select approximately 1,500–2,000 fibers from the laboratory sample. Gently pull and straighten them several times by hand to ensure one end is even and straight, then randomly select a single fiber from the bundle for testing. Take care to avoid damaging, bending, or contaminating the fibers during this process.


3. Power On and Preheat


After connecting the power supply, the instrument must preheat for 30 minutes to allow the internal circuitry and sensors to reach a stable operating state. Parameter settings and sample preparation can be performed during the preheating period to improve testing efficiency.


III. Detailed Explanation of Core Parameter Settings


The appropriateness of parameter settings directly determines the accuracy and comparability of test results. The following are several key parameters that require special attention:


Clamping Distance (Spacing Length)


The clamping distance should be determined based on the average fiber length:

- When the average fiber length is less than 35 mm, set the clamping distance to 10 mm

- When the average fiber length is greater than 35 mm, set the clamping distance to 20 mm


Some newer instruments support arbitrary gap settings within a range of 560 mm, and the instrument can automatically locate the position, significantly improving operational efficiency.


Pre-tension


The purpose of pre-tension is to keep the fiber straight but not under tension prior to testing. Different fibers have corresponding standard values:

- Cotton fibers: 0.2 cN/tex

- Synthetic fibers (e.g., polyester, acrylic): 0.75 cN/tex

- Other fibers (e.g., wool, hemp, silk): 0.5 cN/tex


If the pre-tension is too low, the fiber may be initially bent, resulting in an overestimated elongation; if too high, it may prematurely damage the fiber, leading to an underestimated breaking strength.


Tensile Speed


The setting of the tensile speed is closely related to the fiber’s elongation at break and follows the following principles:

- Elongation at break E < 8% (low-elongation fibers, such as ramie): Tensile speed is 50% of the nominal gauge length per minute

- Elongation at break 8% < E < 50% (medium-elongation fibers, such as cotton and polyester): Tensile speed is 100% of the nominal gauge length per minute

- Elongation at break E > 50% (high-elongation fibers, such as spandex): Tensile speed is 200% of the nominal gauge length per minute


IV. Standard Operating Procedure


Step 1: Access the Parameter Settings Interface


After the instrument has finished warming up, access the main menu or the online software interface. Set the following parameters in sequence: specimen name, linear density, pre-tension, grip distance, tensile speed, load range, number of tests, etc. Save the settings after verifying they are correct.


Step 2: Instrument Calibration and Zeroing


Execute the “Reset” operation to return the lower clamp to its initial position. Use standard weights to calibrate the force measurement (some newer instruments support an automatic calibration procedure, which completes precise linear calibration in just three steps). Then perform the “Tare/Zero” operation to ensure the force display reads zero.


Step 3: Sample Clamping

1. Use tweezers to pick up a single fiber from the felt pad and check that its surface has no obvious defects.

2. Place the upper end of the fiber into the upper clamp and gently tighten the screw to secure it (for pneumatic clamping, press the clamping button).

3. Attach the pre-tension clamp to the lower end of the fiber so that the fiber is naturally straightened.

4. Place the lower end of the fiber into the lower clamp and tighten to secure it.

5. Confirm that the fiber is centered between the upper and lower clamps, with no skewing or tangling


Step 4: Start the Test


After confirming that the specimen is clamped correctly, press the “Test” or “Start” button. The lower clamp descends at a set speed, gradually stretching the fiber. The instrument collects force and elongation data in real time and dynamically displays the tensile curve on the screen.


When the fiber breaks, the lower clamp automatically stops and returns to its initial position. The interface then displays data for this test, including breaking strength, elongation at break, elongation percentage, and break time. Some instruments can also automatically calculate and display derived metrics such as breaking energy and initial modulus.


Step 5: Repeat Testing and Data Management


Test the remaining specimens in sequence according to the steps above. Modern electronic single-fiber tensile testers typically feature automatic statistical functions that can calculate maximum, minimum, and average values, as well as the coefficient of variation (CV), in real time.


After testing is complete, data can be exported in Word, Excel, or TXT formats for subsequent quality analysis and archiving. Some high-end models support the export of test curves and data sampling points, facilitating in-depth analysis using professional software such as Origin.


V. Calculation of Test Results and Interpretation of Indicators


Key Test Indicators


- Breaking force: The maximum load a fiber can withstand before breaking, measured in centinewtons (cN)

- Breaking strength: The ratio of breaking force to linear density, measured in cN/dtex; this is a core indicator for evaluating fiber strength

- Elongation at Break: The percentage increase in length relative to the original clamped length when the fiber breaks, reflecting the fiber’s elasticity

- Work at Break: The work done by the external force on the fiber during tensile testing, reflecting the fiber’s toughness

- Initial Modulus: The slope of the initial linear segment of the stress-strain curve, reflecting the fiber’s stiffness


Calculation Formulas


Average breaking strength = Σ(breaking force) / linear density (cN/dtex)


Elongation at break = (elongation at break / clamping length) × 100%


The reliability of test results can be assessed using the coefficient of variation (CV value). Generally, a CV value of 10%–15% for breaking force is considered within the normal range. If the CV value is too high, check the representativeness of the sample, the standardization of the clamping procedure, or the uniformity of the fiber itself.


VI. Common Issues and Solutions


Clamping Slip


Symptoms: Irregular fluctuations appear in the tensile curve before reaching the peak, or the break occurs at the clamping point rather than in the middle of the fiber.


Causes and Countermeasures:

- Insufficient clamping force: Tighten the clamping screws appropriately, or check the pneumatic system pressure

- Worn jaws: Replace the jaw pads; it is recommended to use specialized jaws with a fine-textured surface

- Excessive pre-tension: Recheck and adjust the pre-tension value


High Data Variability


Symptoms: Significant fluctuations in test results for the same batch of fibers, with a high CV value.


Causes and Solutions:

- Non-representative sampling: Increase the sample size to ensure the sample covers the entire batch of fibers

- Inhomogeneity of the fibers themselves: This is a normal phenomenon; random errors can be reduced by increasing the number of tests

- Inconsistent operating procedures: Strengthen operator training to standardize clamping force and speed


Sensor Drift


Symptoms: The force reading is not zero under no-load conditions, or test values exhibit systematic deviations after calibration.


Causes and Countermeasures:

- Insufficient warm-up time: Ensure a warm-up period of at least 30 minutes

- Environmental vibration interference: Place the instrument on a stable laboratory bench, away from vibration sources

- Sensor aging: Contact the manufacturer for professional calibration or sensor replacement


VII. Applicable Standards and Specifications


Testing methods for electronic single-fiber tensile testers must strictly adhere to relevant standards, primarily including:


- GB/T 9997-1988 “Determination of Breaking Strength and Elongation at Break of Single Chemical Fiber”

- GB/T 14337 “Test Methods for Tensile Properties of Short Chemical Fibers”

- GB/T 4711-1984 “Test Methods for Breaking Strength and Elongation of Single Wool Fibers”

- ISO 5079 “Textile fibers—Determination of breaking strength and elongation at break of single fibers”

- ISO 11566 “Carbon fibers—Determination of tensile properties of monofilament specimens”

- FZ/T 50006, FZ/T 50007 (relevant standards for the chemical fiber industry)
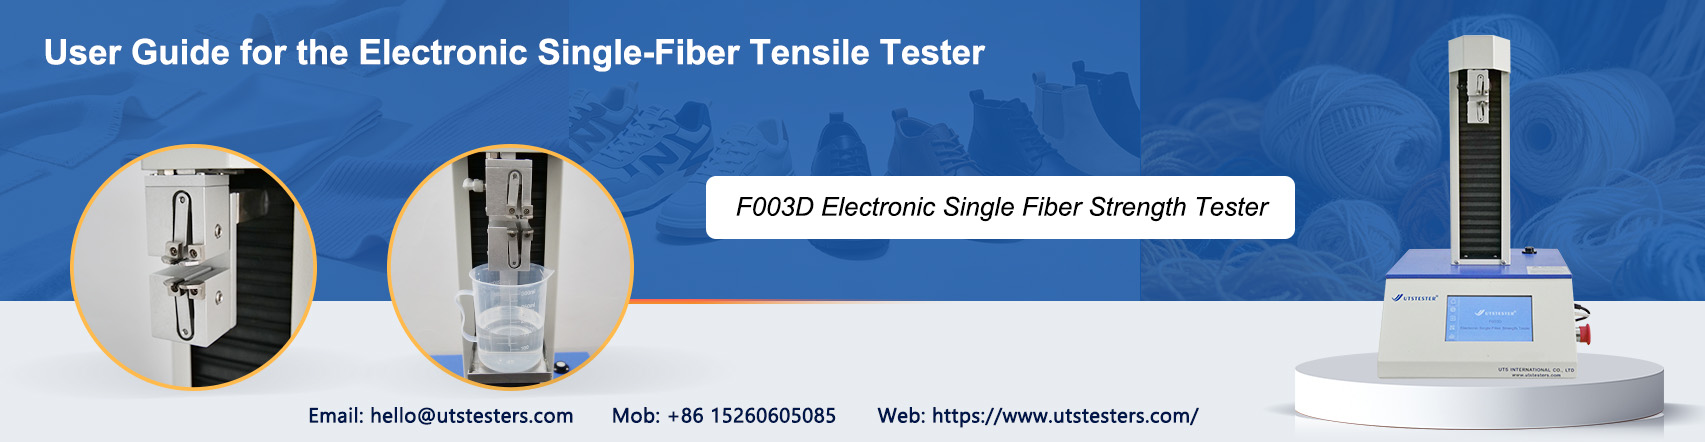
Electronic Single Fiber Strength Tester F003D


Email: hello@utstesters.com

Direct: + 86 152 6060 5085

Tel: +86-596-7686689

Web: www.utstesters.com
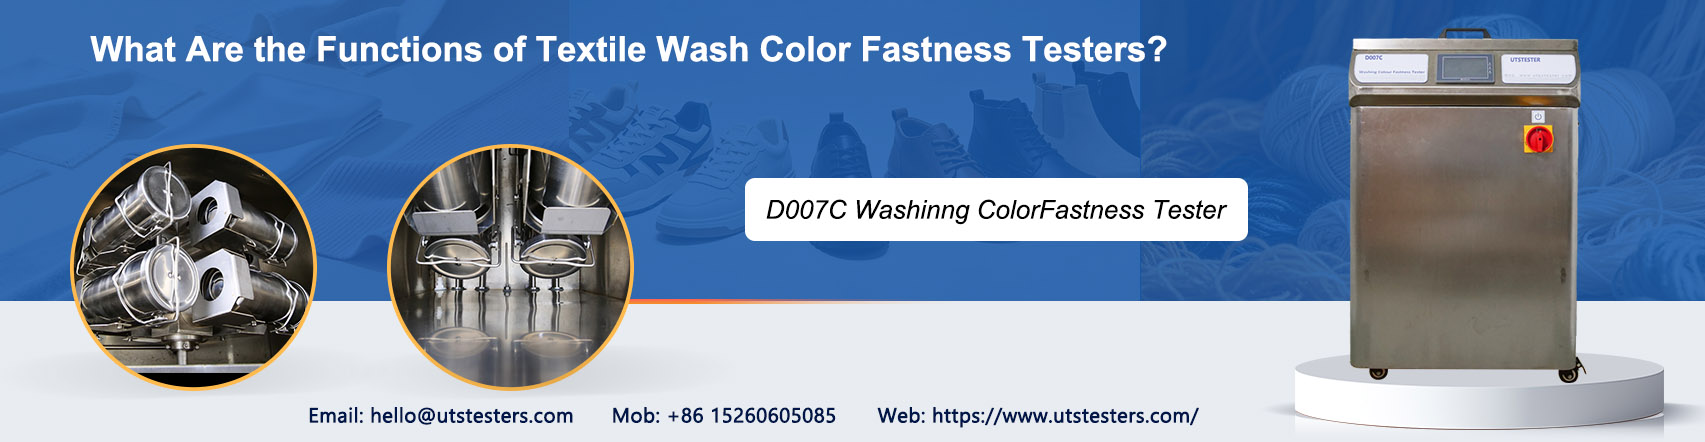


What Are the Functions of Textile Wash Color Fastness Testers?

Throughout the entire process of textile production and quality control, color stability is one of the most intuitive and sensitive quality indicators for consumers. If a brightly colored garment fades or bleeds after just a few washes, it not only affects the wearing experience but may also directly undermine consumer trust. Wash color fastness testers are the core equipment used to evaluate this critical performance characteristic.


I. Simulating Real-World Washing Conditions

Wash fastness testers precisely simulate everyday washing scenarios under laboratory conditions. The instrument simulates the washing process by sewing or layering the test textile with a standard white backing fabric and placing it in a solution with specific temperature, detergent concentration, and mechanical agitation intensity. During the washing process, stainless steel beads tumble and collide within the container, simulating the agitation and friction exerted by a washing machine on garments. After the test, the degree of color change in the test specimen and the degree of color transfer to the backing fabric are evaluated using color change and color transfer gray scales, resulting in a color fastness rating on a scale of 1 to 5.


This accelerated testing method enables the prediction of a textile’s color performance during long-term practical use within a short period of time, helping companies identify potential fading risks in advance and prevent defective products from entering the market.


II. Covers a Wide Range of Textile Types

The wash fastness tester is not limited to a single material; it has a very broad range of applications. Whether natural fibers such as cotton, wool, silk, and linen, or synthetic fibers such as polyester, nylon, acrylic, and spandex, as well as various blended, knitted, and woven fabrics, all can be tested using this equipment. In addition, it can evaluate the wash fastness of the dyes themselves, providing data support for formulation optimization in printing and dyeing enterprises.


From apparel and home textiles to industrial textiles, virtually all products that undergo a washing process rely on this fundamental and critical test.


III. Support for Multiple Testing Standards

Modern wash fastness testers are typically compatible with major international standards such as ISO 105-C06, AATCC 61, GB/T 3921, JIS L0844, BS 1006, and other mainstream international standards; some high-end devices also support internal testing specifications from brands such as M&S and NEXT.


This means that a single device can help enterprises conduct multi-standard testing for markets in Europe, the United States, Japan, South Korea, and China, significantly reducing laboratory equipment investment costs while ensuring that export products successfully meet the quality requirements of their target markets.


IV. Ensuring Consumer Safety

Textiles with poor colorfastness may release dyes that enter the body through skin contact, posing potential health risks to sensitive individuals, especially infants and young children. In addition, color bleeding from dark-colored garments onto light-colored ones during washing is a common occurrence.


Through rigorous testing with a wash fastness tester, companies can ensure their products comply with environmental and safety regulations , effectively avoiding recalls, claims, and damage to brand reputation caused by quality issues. For close-to-the-skin textiles such as infant and toddler clothing, underwear, and sportswear, this testing is an indispensable part of quality control.


V. Improving Laboratory Efficiency

The UTSTESTER Wash Fastness Tester is equipped with a digital temperature control system, a programmable timer, and a touchscreen interface. It supports real-time display of temperature curves, customizable test program editing, and the storage and export of experimental data.


These features make the testing process more standardized and repeatable, reducing human operational errors. At the same time, its batch testing capability and rapid sample preparation workflow (such as integration with an automatic solution preparation system) significantly increase laboratory testing throughput, meeting the high-frequency testing demands of large-scale production.

Washing Colorfastness Tester D007C


Email: hello@utstesters.com

Direct: + 86 152 6060 5085

Tel: +86-596-7686689

Web: www.utstesters.com

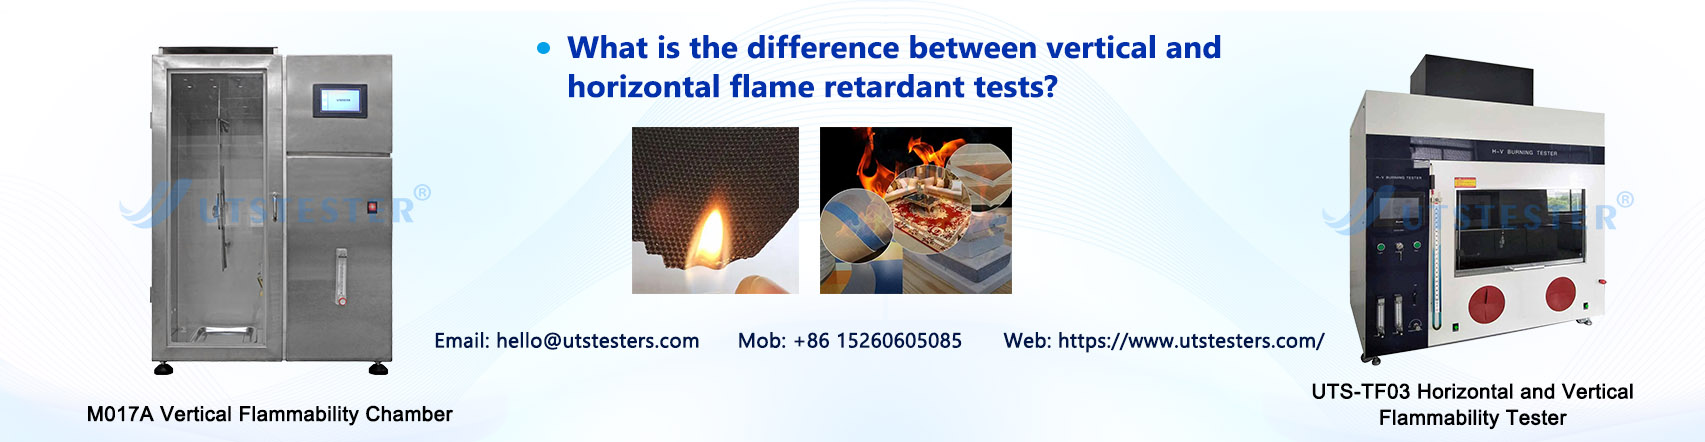
What is the difference between vertical and horizontal flame retardant tests?

During a fire, a material's combustion characteristics directly impact the speed of fire spread and the time available for evacuation. Ordinary plastics, textiles, and similar materials ignite upon contact with fire, producing large amounts of toxic smoke and dripping debris that accelerate fire propagation and hinder escape. Scientifically engineered flame-retardant materials, however, suppress flame spread during the initial stages of a fire, buying crucial time for evacuation and firefighting operations. While both vertical and horizontal flame retardancy tests are commonly used to evaluate flame-retardant performance, their simulated fire scenarios and testing methodologies differ significantly, resulting in distinct application scopes and evaluation criteria.


I. Common Plastic Flame Retardant Testing Standards:


UL 94-2023 REV.2:2024 “UL Standard for Safety Tests for Flammability of Plastic Materials for Parts in Devices and Appliances - Seventh Edition”

GB/T 2408-2021 “Plastics - Determination of Burning Behavior - Horizontal and Vertical Methods”

Application Scope: Plastics, foamed plastics, films, textiles, coatings, rubber, and other materials; as well as electronic/electrical products (e.g., enclosures, PCBs, cables), building materials, automotive/vehicle interior components, furniture, children's toys, etc.


II. Core Differences: Variations in Testing Methods and Scenario Simulation


The fundamental distinction between the two tests stems from their differing simulations of real-world fire scenarios, which inherently dictate variations in testing apparatus and operational procedures.


1. Horizontal Flame Retardancy Test: Simulates combustion behavior of horizontally laid materials


Test Principle: Simulates material combustion in a horizontal plane. By measuring the burning rate of a sample under specified conditions, it evaluates relative flame retardancy. The core objective is to quantify the speed at which flames propagate across the material surface—a metric directly linked to the initial fire spread rate.


Test Overview: A pretreated standard specimen is clamped horizontally. A test flame of specified height (e.g., 20mm) is applied to the free end for a defined duration (e.g., 30 seconds) or until reaching a predetermined mark before removal. The sample's flaming burn time, burn length, and burn rate are then precisely recorded. Based on standard criteria, this fundamental flame-retardant test method evaluates the relative ease of horizontal combustion for materials. It primarily simulates ignition scenarios for horizontally laid materials like carpets, floor coverings, and tablecloths.


During testing, the distance between the ignition source and the specimen's edge must be precisely controlled to ensure stable flame exposure. The time required for flame spread over a specific distance is recorded to calculate the burning rate.


2. Vertical Flame Retardancy Test: Simulates the burning behavior of vertically suspended materials


Test Principle: Evaluates a material's self-extinguishing capability, burning duration, and potential for burning droplets after controlled ignition in a vertical orientation. The critical test requirement is that the material must self-extinguish rapidly after the ignition source is removed. Any dripping burning particles must not ignite flammable materials below (e.g., cotton wool). This directly relates to preventing vertical fire spread and secondary ignition during a fire.


Test Overview: The vertical burning test involves vertically clamping a standard specimen subjected to two pretreatments (70°C, 7-day high-temperature aging and 23°C, 50% RH humidity conditioning). A flame is applied twice at the specimen's lower end for standard durations (10 seconds each, with intervals until self-extinguishment). Precise measurements are taken of the flaming burn time, smoldering burn time, and ignition of cotton wool by burning droplets after each flame application. A professional evaluation method determines the V-0/V-1/V-2 flame retardancy rating based on observations of the worst-performing pretreated sample.


During testing, the specimen must be placed in a sealed combustion chamber meeting the dimensional requirements of ≥330mm × 330mm × 765mm. The chamber interior must feature black walls to eliminate reflective interference, and a layer of cotton wool must be placed at the bottom to detect ignition risks from burning drips.


III. Key Dimension Comparison: Metrics, Standards, and Scope of Application


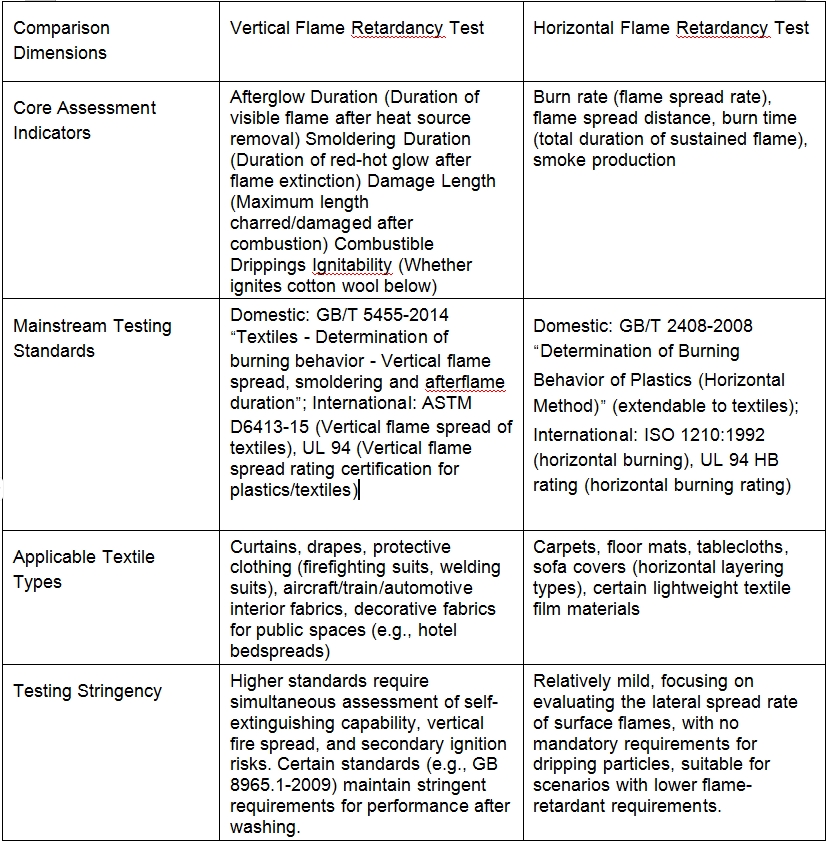
Based on differences in simulated scenarios, the core evaluation metrics, applicable standards, and application domains of the two tests are clearly differentiated. Specific comparisons are as follows:

IV. Practical Application: How to Select the Appropriate Test Method?


The two test methods are not a matter of “superiority or inferiority,” but rather “scenario suitability.” Enterprises must choose the test method based on the product's actual usage state and the regulatory requirements of the target market:


1. Situations Requiring Vertical Flame Retardancy Testing

Vertical flame retardancy testing is mandatory for products used in vertical hanging or vertical application scenarios, or when high safety ratings are required. Examples include:

1.1 Curtains and drapes for public spaces (must meet GB 50222-2001 B1/B2 requirements, tested per GB/T 5455);

1.2 Flame-retardant protective clothing (e.g., welding suits, industrial flame-retardant garments; must meet GB 8965.1-2009 Class A/B/C requirements, tested per GB/T 5455);

1.3 Aircraft and train interior fabrics (must prevent burning droplets from igniting degreased cotton, tested per GB/T 5455).


2. Situations Where Horizontal Flame Retardancy Testing is Preferred

Horizontal flame retardancy testing may be used when products are intended for horizontal application and basic flame retardancy requirements apply. Examples include:

2.1 Home carpets and tablecloths (no mandatory high flame retardancy rating required; focus on controlling burning rate);

2.2 Lightweight textile film materials (e.g., packaging films requiring assessment of surface flame spread risk);

2.3 Horizontal covering materials in automotive interiors (some standards permit horizontal testing for flame spread rate, e.g., FZ/T 01028).


V. Conclusion: Precise Testing Ensures Safety and Compliance


The core distinction between vertical and horizontal flame retardancy testing lies in “simulation scenario specificity”: Vertical testing focuses on vertical spread and secondary ignition risks, suited for vertically used products with high safety requirements; Horizontal testing emphasizes lateral spread rate, catering to products with basic flame-retardant requirements for horizontal applications. For textile enterprises, clearly distinguishing these differences not only ensures product compliance with target market regulations (e.g., GB 17591-2006 “Flame-Retardant Fabrics,” UL 94) but also enables optimization of material formulations and production processes through precise testing, thereby enhancing product safety competitiveness.


Email: hello@utstesters.com

Direct: + 86 152 6060 5085

Tel: +86-596-7686689

Web: www.utstesters.com
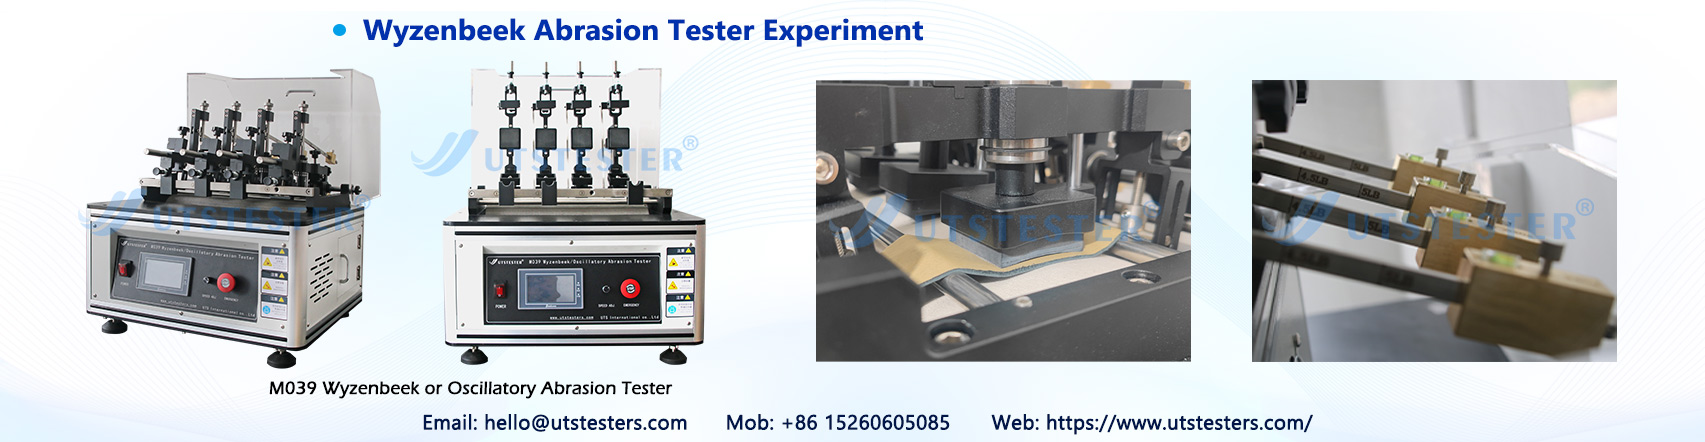
Wyzenbeek Abrasion Tester Experiment

I. What Is the Wyzenbeek Abrasion Test?

The Wyzenbeek abrasion test, also known as the Oscillatory Cylinder Method, is one of the most widely used methods for testing fabric abrasion resistance in North America. Named after its inventor, Wyzenbeek, this test evaluates a fabric’s durability under repeated friction by simulating the repetitive rubbing motion of a person on a seat.

Test results are expressed in “Double Rubs,” representing the number of back-and-forth friction cycles a fabric can withstand before showing significant wear. This metric serves as a core reference for material selection in industries such as furniture, automotive interiors, and aircraft seating.


II. Test Principles and Core Mechanisms

2.1 Basic Principles

The core principle of the Wyzenbeek test is to tightly secure a fabric specimen under controlled conditions and subject it to reciprocating friction against a standard abrasive (typically cotton canvas or metal mesh) on a curved surface.

Specifically:

- The specimen is mounted in the tester’s fixture, with specified tension and pressure applied

- The abrasive is mounted on the curved surface of a swinging drum and moves back and forth at a speed of approximately 90 cycles per minute

- Each complete “outward + return” cycle counts as one double rub

- The test continues until the specimen exhibits a specified degree of wear


2.2 Determination of Test Termination

According to ASTM D4157, the test is terminated when one of the following three conditions occurs:

Two or more yarns break: Two or more yarns break on the specimen surface

Significant wear: Visible, significant wear, pilling, or thinning occurs

100,000 double rubs are reached: This is the upper limit; exceeding this value typically does not indicate an improvement in actual service life

> Note: The specimen should be inspected every 5,000 double rubs. If failure is detected at a given inspection point, the result at the previous 5,000-rub inspection point should be recorded as the final result. Therefore, Wyzenbeek results are typically reported in increments of 5,000 rubs.


III. Applicable Standards

The Wyzenbeek Abrasion Tester complies with the following standards:

- ASTM D4157 — Standard Test Method for Abrasion Resistance of Textile Fabrics (Pendulum Method)

- ASTM D3597 — Standard Test Method for Evaluation of Physical Properties of Textile Fabrics

- ISO 12402-7 — Test Method for Abrasion Resistance of Personal Flotation Devices

- FTMS 191A 5304 — Federal Test Method


IV. Features of the Wyzenbeek Abrasion Tester

- Stainless steel and aluminum alloy construction: Ensures long-term durability of mechanical components

- Brushless motor system: Smooth operation with low noise

- Sealed drive mechanism: Dust-proof design for easy maintenance

- Vacuum port: Removes fiber debris generated by friction in real time to prevent interference with test results


V. Detailed Experimental Procedure

1. Sample Preparation - Cut samples from both the warp and weft directions of the fabric to be tested

2. Installing the Abrasive - Securely mount standard #10 cotton canvas (or metal mesh, for olefin and low-melting-point fibers) onto the curved surface of the oscillating drum

3. Installing the Test Specimen - Clamp both ends of the specimen into the test fixtures. Adjust the tension and pressure weights to ensure the specimen surface is flat, taut, and free of slack or distortion

4. Set test parameters—Set the target number of friction cycles on the control panel and confirm the oscillation speed

5. Perform the test—Start the equipment to begin the back-and-forth friction

6. Determine the end point and record results—When two yarns break or show significant wear, record the current cycle count and calculate the average number of double friction cycles for both the warp and weft specimens

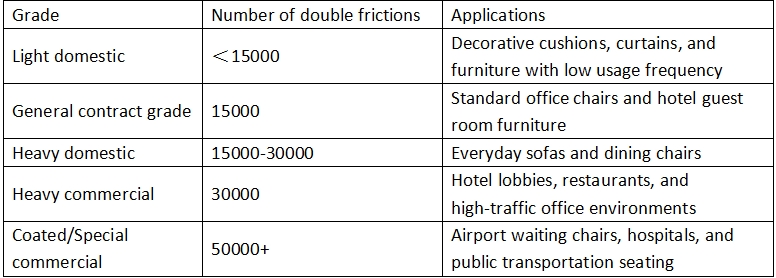
VI. Result Grading and Application Guidelines

VII. Frequently Asked Questions and Precautions

Q1: Why are test results reported in increments of 5,000 cycles?

A: Because the standard specifies that the specimen be inspected every 5,000 cycles. If the specimen fails at 35,200 cycles, the result should be recorded as 35,000 cycles to ensure the consistency and repeatability of the test.

Q2: What is the difference between metal mesh abrasives and cotton canvas abrasives?

A: Cotton canvas is the standard abrasive and is suitable for most fabrics. Metal mesh abrasives are specifically recommended for olefin fibers and low-melting-point fibers, as these materials may melt and adhere when rubbed against cotton canvas.

Q3: Does the tester require regular calibration?

A: Yes. A comprehensive calibration is recommended once a year.

Q4: How can testing efficiency be improved?

A: Choosing a 4-station device allows for simultaneous testing of warp, weft, and samples under different conditions, significantly increasing testing throughput. Models equipped with an automatic shutdown function can complete testing unattended.

Wyzenbeek or Oscillatory Abrasion Tester


Email: hello@utstesters.com

Direct: + 86 152 6060 5085

Tel: +86-596-7686689

Web: www.utstesters.com


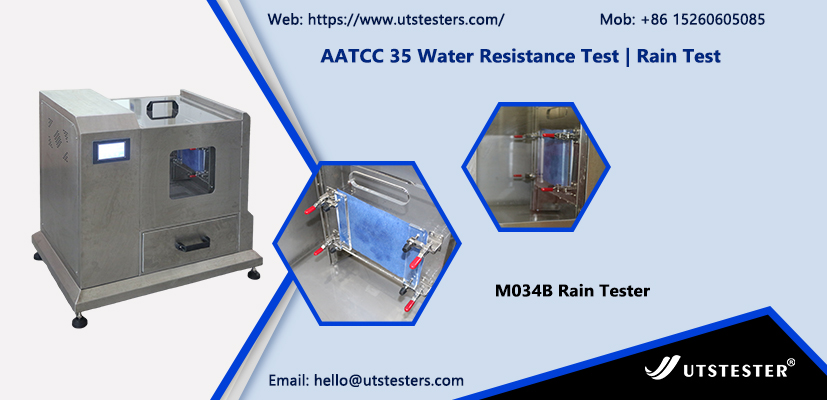
AATCC 35 Water Resistance Test | Rain Test

1. Why Do We Need the AATCC 35 Rain Test?


In the development and quality control of outdoor clothing, functional fabrics, and protective gear, "waterproof" is a core metric. But consumers care less about lab data and more about whether the clothing can actually resist sudden rain while being worn. AATCC 35 (Water Resistance: Rain Test) simulates real rain impact scenarios to quantitatively evaluate a fabric's resistance to water penetration under dynamic pressure, making it a key test for predicting actual rainproof performance.


2. Test Principle


A pre-weighed standard absorbent paper is placed behind the specimen, and water is sprayed onto the surface of the specimen at a specific pressure and angle. After a set period, the absorbent paper is weighed again. The difference between the two weights shows the amount of water that has passed through the fabric—the smaller the number, the better the waterproof performance.


The advantage of this method is that the results are objective and measurable. Unlike the spray test that relies on visual observation (AATCC 22), AATCC 35 directly reflects water penetration through the weight gain of the absorbent paper, avoiding subjective judgment bias.


3. Key Test Conditions and Parameters


Sample Preparation: Cut at least three specimens and condition them with the standard absorbent paper under standard atmospheric conditions (temperature 21±1°C, relative humidity 65±2%) for at least 4 hours to ensure consistent test environments.


Spray Parameters: Water temperature should be controlled at 27±1°C, with the nozzle 305mm from the surface of the specimen. Standard spray time is 5 minutes, though some customer agreements may require 2 minutes. Water pressure height can be adjusted according to needs, common levels include 600mm, 915mm, 1220mm, up to a maximum of 2440mm, simulating light rain to heavy downpour.


Result Determination: The average weight gain of the absorbent paper from the three specimens is taken as the final result. If the result exceeds 5.0g, it is usually reported as ">5.0g". For general clothing fabrics, the U.S. market usually requires the absorbent paper weight gain to be no more than 1.0g, and some high-standard scenarios even require ≤0.5g.


4. Differences Between AATCC 35 and Other Waterproof Tests


Within the family of textile waterproof tests, AATCC 35, AATCC 22 (spray test), and AATCC 127 (hydrostatic pressure test) each have their focus:


- AATCC 22 Spray Test: Focuses on assessing the fabric's 'water repellency'—whether water droplets can roll off the surface. It rates the sample by comparing how wet the fabric surface is after spraying against standard reference samples, which is a qualitative or semi-quantitative evaluation.

- AATCC 127 Hydrostatic Pressure Test: Measures the fabric's ability to resist penetration under static water pressure, suitable for items like tents and raincoats that need to withstand some water pressure.

- AATCC 35 Rain Test: Focuses on how much water penetrates under dynamic impact, better simulating the scenario of rain hitting the fabric during actual wear, making it especially suitable for evaluating the water resistance of clothing fabrics.


In short: AATCC 22 checks 'surface water repellency,' AATCC 127 checks 'pressure resistance,' and AATCC 35 checks 'actual water penetration.' The three complement each other, together forming a complete system for evaluating waterproof performance.


5. Key Factors Affecting Test Results


The results of AATCC 35 tests are not just isolated numbers—they are influenced by multiple intertwined factors:


Fiber and yarn water repellency: Natural fibers like cotton are highly absorbent. Even after waterproof finishing, their inherent hydrophilicity can still affect the final performance. Synthetic fibers like polyester and nylon are naturally more hydrophobic, making it easier to achieve lower water penetration.


Fabric structure: A tight plain weave usually blocks water molecules better than a loose knit. However, overly tight fabrics may increase the risk of penetration under dynamic impact due to capillary effects, so a balance in structural design is needed.


Post-treatment processes: The type, dosage, and curing conditions of DWR (durable water-repellent) finishes directly affect the fabric’s waterproof performance. It’s worth noting that uneven coating across different parts of the same fabric can lead to significant variation in test results—something that quality control needs to pay close attention to.


Consistency of test conditions: Minor deviations in water temperature, water pressure stability, nozzle blockage, and ambient temperature and humidity can cause result fluctuations of over 10%. Therefore, using professional testing equipment that is stable and highly automated is crucial.


6. Conclusion


The value of the AATCC 35 rain test is not only in providing a quantifiable "scale" for fabric waterproof performance but also in bridging laboratory data with real-world rainy wearing experiences.


If you want to learn more about the technical specifications or purchasing advice for the AATCC 35 rain tester, feel free to contact the UTSTESTER technical team.

Rain Tester


Email: hello@utstesters.com

Direct: + 86 152 6060 5085

Tel: +86-596-7686689

Web: www.utstesters.com

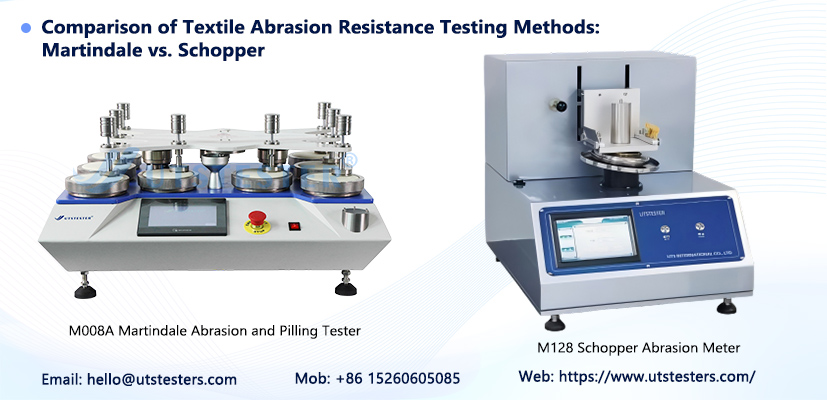
Comparison of Textile Abrasion Resistance Testing Methods Martindale vs. Schopper

I. Introduction: Abrasion Resistance Is the “Litmus Test” of Textile Durability


Friction is ubiquitous throughout the lifecycle of textiles. From daily contact with the human body and furniture to the repeated rubbing of upholstery fabrics against clothing, and even the intense friction endured by car seats as passengers get in and out, abrasion resistance directly determines how long a textile will last for the consumer. Therefore, abrasion resistance testing is not only a critical component of quality control but also a key basis for product pricing, market positioning, and technological R&D.


Currently, the two most commonly used abrasion testing methods are the Martindale Method and the Schopper Method. Although both share the same objective—to evaluate a textile’s resistance to wear—they differ fundamentally in testing principles, motion mechanisms, standard systems, and applicable scenarios.


II. The Martindale Method


2.1 Test Principle


The core of the Martindale method lies in its unique Lissajous figure motion trajectory. During testing, a circular specimen is brought into contact with a standard wool abrasive under a specified pressure, while the friction head moves along a specific geometric trajectory: starting as a straight line, gradually widening into an ellipse, then narrowing back to a straight line. Each complete cycle consists of 16 revolutions. This multidirectional, multidimensional friction method simulates the complex wear scenarios encountered when fabrics come into contact with different surfaces and at various angles during actual use, resulting in test results that closely correlate with real-world wear experiences.


2.2 Standard System and Evaluation Dimensions


The Martindale method boasts the most comprehensive international standard system currently available. Core standards include the ISO 12947 series, the Chinese National Standard GB/T 21196 series (with the new version GB/T 21196.2-2025 set to take effect on March 1, 2027), and the American ASTM D4966 standard. In addition, modified Martindale methods are widely used for pilling and fuzzing tests, with corresponding standards including ISO 12945-2, GB/T 4802.2, and ASTM D4970.


In terms of result evaluation, the Martindale method provides three complementary dimensions:


Specimen Breakage Method: This is the most commonly used evaluation method, offering intuitive results with minimal error. When at least two yarns in a woven fabric break completely, or a hole forms in a knitted fabric due to a single yarn break, or the coating on a coated fabric is partially damaged and the base fabric is exposed, the number of friction cycles at that point is recorded as the abrasion resistance index. This method is suitable for the vast majority of textile fabrics, including nonwovens and coated fabrics, but is not applicable to fabrics with extremely short wear life.


Mass Loss Method: By measuring the change in mass after a specified number of friction cycles, this method reflects the performance degradation of the fabric at different stages of wear. This method is more suitable for process optimization in manufacturing enterprises and in-depth analysis by research institutions.


Appearance Change Evaluation Method: For fabrics with a short wear life, this method evaluates the degree of discoloration, pilling, and fuzzing by comparing against a gray scale chart; the effective load mass is typically around 198 grams.


2.3 Test Parameters and Application Characteristics


The standard pressure for the Martindale method is typically set at 9 kPa (for apparel) and 12 kPa (for decorative fabrics). Under the Chinese standard system, the total load for woven fabrics is 415 grams and 155 grams for knitted fabrics; whereas the U.S. ASTM standard uses a 198-gram abrasion head weight. The specimen size is typically 38 mm in diameter, with a friction path of 60 mm.


The advantage of this method lies in its high international applicability and a mature, well-established standard system, enabling the simultaneous evaluation of both abrasion resistance and pilling resistance. Consequently, it is widely used in the fields of apparel fabrics (such as denim, workwear, and outdoor jackets), home textiles (sofa fabrics, curtains, and bedding), and automotive interiors.


III. Schober Method


3.1 Test Principle


Unlike the planar multidirectional friction of the Martindale method, the Schober method employs the principle of rotary abrasion. During testing, a circular specimen with an area of 100 square centimeters is mounted on a rotating test head. It rotates alternately clockwise and counterclockwise at a speed of 75 revolutions per minute, maintaining linear contact with the abrasive paper to generate tangential friction. The rotation direction automatically switches every 100 friction cycles to ensure uniform wear.


This motion is characterized by stress concentration. As the specimen rotates, it forms a line contact with the abrasive paper, resulting in more intense and direct friction. This makes it particularly suitable for evaluating a material’s abrasion resistance under high tension and high pressure conditions.


3.2 Standard System and Industry Positioning


The standard system for the Schober method is relatively centralized, primarily built around the German DIN 53863 Part 2 standard, “Abrasion Testing of Textile Surfaces (Rotary Abrasion Test).” In the automotive industry, it has been adopted by the supply chain standards of several major automakers, including General Motors’ GME 60345 and GMW 3283 standards, Volkswagen/Audi’s PV 3908 standard, and the Chinese automotive industry standard QC/T 216-1996.


3.3 Test Parameters and Adjustment Flexibility


The Schober method offers significant flexibility in test parameter settings. The rotational speed is fixed at 75 revolutions per minute, the cone angle is 166 degrees, and the test head bracket is inclined at 7 degrees. The crown height of the specimen can be adjusted between 0 and 10 millimeters, typically set between 5 and 8 millimeters.


The load pressure range is wide, adjustable from 0.5 N to 25 N. Standard weights include 50 g, 100 g, 250 g, 500 g, 1000 g, and 1500 g. The selection of pressure is typically based on the specimen’s mass per unit area: 1.0 Newton is used for less than 100 g/m², 2.0 Newton for 100 to 150 g/m², 5.0 Newton for 150 to 300 g/m², and 10.0 Newton for over 300 g/m².


3.4 Application Areas and Core Advantages


Due to its high pressure and rotational friction characteristics, the Schober method offers irreplaceable value in specific fields. It is primarily used for automotive interior materials (seat fabrics, door panel coverings, headliner fabrics), heavy-duty industrial fabrics (canvas, tent materials), various coated fabrics (PVC or PU-coated fabrics, laminated materials), as well as leather and synthetic leather products. Within the automotive supply chain, the Schober method is frequently used to evaluate the durability of materials when passengers frequently get in and out of seats.


IV. Core Differences Between the Two Methods


4.1 Motion Patterns and Friction Mechanisms


The Lissarou diagram of the Martindale method achieves multidirectional, distributed planar friction, with stress evenly distributed across the specimen surface. This more closely approximates the real-world conditions of random contact between clothing and various surfaces in daily life. In contrast, the rotational tangential friction of the Schober method creates line contact, resulting in relatively concentrated stress and more intense friction, which better simulates specific high-wear environments such as industrial settings or automotive seats.


4.2 Standard Maturity and Global Applicability


The Martindale method holds an unparalleled position within the international standards system. From ISO to GB, ASTM, and EN, a complete, unified, and widely accepted set of testing specifications has been established. The standard system for the Schober method is primarily concentrated in German DIN standards and internal automotive industry specifications.


4.3 Specimen Requirements and Testing Efficiency


The Martindale method typically uses small test specimens with a diameter of 38 mm, resulting in a test area of approximately 11.3 cm². For highly wear-resistant materials, tens of thousands of friction cycles may be required before failure occurs, resulting in a relatively long testing cycle. The Schober method uses large test specimens with a diameter of 100 mm, resulting in a test area of 50 cm². Due to the concentration of friction stress, failure or significant mass loss is typically achieved more quickly, resulting in relatively higher testing efficiency.


4.4 Differences in Abrasives and Consumables


The Martindale method uses standard wool abrasives, which can be reused until they reach their wear limit, making them suitable for long-term use. The Schober method typically uses silicon carbide sandpaper as the abrasive; the sandpaper gradually becomes dull during testing and is generally treated as a disposable consumable.


4.5 Methods of Result Evaluation


The Martindale method yields results in various forms, including abrasion cycles, mass loss rate, and appearance grade; however, the determination of failure and appearance assessment rely to some extent on the operator’s experience, and subjective factors may lead to inter-laboratory variations. The Schober method uses mass loss as the primary quantitative indicator, yielding more objective results; however, standardized procedures are also required for determining perforation and describing appearance.


V. Conclusion


The Martindale and Schober methods are not simply interchangeable; rather, they are specialized tools designed for different application scenarios. The Martindale method, with its strong international applicability, comprehensive standard system, and ability to simulate real-world usage conditions, has become the undisputed “gold standard” in the apparel and home textile industries. The Schober method, on the other hand, holds a significant position in the automotive interior and industrial materials sectors due to its concentrated stress from rotational friction, high testing efficiency, and objective, quantifiable results.

Technical standards referenced in this article: GB/T 21196-2025, ISO 12947, ASTM D4966, DIN 53863 Part 2, GMW 3283, etc.

Email: hello@utstesters.com

Direct: + 86 152 6060 5085

Tel: +86-596-7686689

Web: www.utstesters.com

Analysis of Factors Affecting Fabric Water Vapor Permeability

I. What Is Fabric Water Vapor Permeability?


Fabric water vapor permeability refers to a fabric’s ability to allow water vapor to pass through it, and it is one of the core indicators for evaluating the comfort of functional textiles. During physical activity, the skin continuously evaporates moisture (sweat). If the fabric cannot promptly expel this water vapor, a hot and humid microenvironment will form on the skin’s surface, leading to discomfort.


Water vapor permeability and water repellency together constitute the dual standards of “breathability” and “protection” for outdoor functional apparel. An excellent piece of functional apparel must both block the intrusion of external liquid water and rapidly expel water vapor from the body—this is precisely where the value of water vapor permeability research lies.


II. Testing Methods for Water Vapor Permeability


1. Desiccant Method (Positive Cup Method)

Standards: GB/T 12704.1, ASTM E96, JIS L1099 A-1

Principle: A desiccant (anhydrous calcium chloride) is placed in a moisture permeability cup, and the test sample is sealed at the cup opening. After being kept in a constant temperature and humidity environment for a specified period, the moisture permeability is calculated by measuring the weight gain of the desiccant.

Features: The test conditions are mild and closely resemble actual wearing conditions, making it the most commonly used testing method in China.


2. Evaporation Method (Water Method, Inverted Cup Method)

Standards: GB/T 12704.2, ASTM E96 BW, JIS L1099 B-1

Principle: A specific volume of distilled water is placed in a moisture transmission cup. After sealing the sample, the cup is inverted. Water vapor passes through the sample and evaporates outward; the moisture transmission rate is calculated by measuring the decrease in water mass within the cup.

Features: Testing conditions are relatively harsh, simulating a high-humidity environment, making it suitable for waterproof and breathable fabrics.


3. Sweating Guarded Hotplate Method

Standards: ISO 11092, GB/T 11048

Principle: A porous metal plate is used to simulate skin perspiration. The energy required to maintain a constant temperature is measured, directly yielding the fabric’s moisture resistance (Ret) and water vapor transmission index (imt).

Features: This method more closely approximates actual human physiological conditions and is considered the “gold standard” for evaluating thermal and moisture comfort.


III. Key Factors Affecting the Moisture Permeability of Fabrics


(Ⅰ) Fiber Raw Material Factors


1. Moisture Absorption of Fibers

The moisture absorption of fibers is the foundation for determining moisture permeability. Based on how fibers interact with water, they can be classified as follows:


- Hydrophilic fibers: cotton, viscose, wool, silk, etc. The molecular structure of these fibers contains hydrophilic groups (-OH, -COOH, -NH₂), which can adsorb water molecules via hydrogen bonding and transport them through diffusion within the fiber. Fibers with strong moisture absorption typically exhibit better moisture vapor permeability.

- Hydrophobic fibers: Synthetic fibers such as polyester, nylon, and polypropylene. These fibers do not absorb water themselves; water vapor is primarily transported through the pores in the gaps between fibers. Although the moisture vapor transmission capacity of a single fiber is limited, excellent moisture vapor transmission performance can be achieved through specialized structural designs.


2. Fiber Fineness and Cross-Section Shape


- Fiber fineness: The finer the fiber, the larger the specific surface area, and the more dense the capillary network formed between fibers, which facilitates the conduction of water vapor. Fabrics made from ultra-fine fibers (<0.5 dtex) typically exhibit superior moisture vapor transmission performance.

- Cross-sectional Shape: Fibers with non-circular cross-sections (such as cross-shaped, trefoil-shaped, or hollow fibers) can form more pore channels compared to circular fibers, thereby increasing the pathways for water vapor transmission. For example, hollow polyester fibers not only reduce weight but also significantly enhance moisture permeability and thermal insulation.


(II) Yarn Structure Factors


1. Yarn Twist

Twist directly affects the density and porosity of the yarn:


- Low-twist yarn: The yarn is loose, with large gaps between fibers, resulting in low resistance to water vapor transmission and good moisture permeability. However, the yarn has lower strength and reduced abrasion resistance.

- High-twist yarn: The yarn is compact, with reduced gaps between fibers, leading to increased resistance to water vapor transmission and reduced moisture permeability. However, the yarn has high strength, and the fabric feels stiff and crisp.


2. Yarn Blend Ratios


- Cotton/Polyester Blends: Cotton fibers provide moisture absorption and wicking capabilities, while polyester provides strength and quick-drying properties. When the cotton content is between 40% and 60%, moisture permeability and durability achieve a good balance.

- Wool/Nylon Blends: The natural moisture-absorbing properties of wool combined with the strength of nylon are commonly used in high-end outdoor apparel.


(III) Fabric Structure Factors


1. Fabric Density and Tightness


- Increased Density: Warp and weft yarns are arranged more tightly, reducing fabric porosity, increasing resistance to water vapor transmission, and lowering moisture permeability.

- Decreased density: Fabric porosity increases, improving moisture vapor permeability, but this may lead to reduced wind resistance and insufficient strength.


2. Fabric Thickness

Fabric thickness is inversely correlated with moisture vapor permeability: the diffusion resistance that water vapor must overcome to pass through the fabric is directly proportional to its thickness.


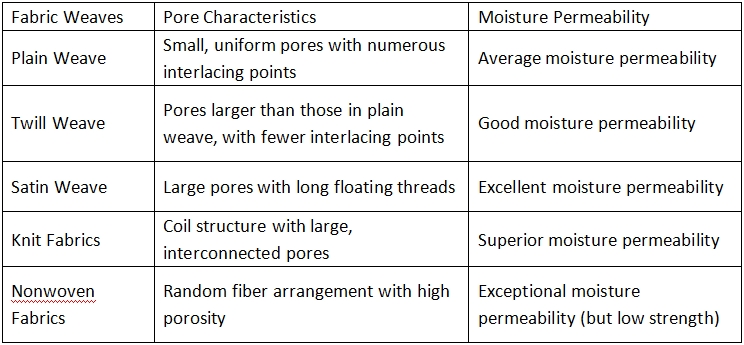
3. Weave Structure

The pore morphology formed by different weave structures varies significantly:


4. Multi-layer Composite Structures

Modern functional apparel often employs multi-layer composite designs:


- Two-layer fabrics: The outer layer is windproof and waterproof, while the inner layer wicks away moisture and sweat; the “pump effect” created by the pores between the layers enhances moisture vapor permeability.

- Three-layer composites: Fabric + waterproof and breathable membrane + lining. The membrane’s microporous structure allows water vapor molecules to pass through while blocking liquid water.


(IV) Post-processing Factors


1. Coating Treatments

Coating is a key method for modifying moisture vapor permeability:


- PU Coating: Standard PU coatings block fabric pores, significantly reducing moisture vapor permeability. However, microporous PU or hydrophilic PU coatings can maintain a certain level of moisture vapor permeability while retaining waterproofing properties.

- Microporous PTFE Membrane: Features extremely high porosity and very small pore sizes, offering high moisture vapor transmission rates and water pressure resistance.

- Non-porous hydrophilic membranes: These utilize a “adsorption-diffusion-desorption” moisture transmission mechanism via hydrophilic groups on the molecular chains. While their moisture permeability is slightly lower than that of microporous membranes, they offer better wash resistance.


2. Water-repellent and moisture-permeable finishing agents

- Fluorocarbon compounds: These impart water- and oil-repellent properties to fabrics but have a certain negative impact on moisture permeability.

- Silicone-based compounds: Form a breathable film on the fiber surface, with minimal impact on moisture permeability.

- Nanotechnology treatments: Such as nano-SiO₂ and TiO₂, which impart special functions while maintaining porosity.


3. Moisture-Wicking Finishes

Treating hydrophobic synthetic fiber fabrics with hydrophilic finishing agents (such as polyether-based or polyacrylic-based compounds):


- The finishing agents form a hydrophilic layer on the fiber surface, improving surface wettability.

- A wicking effect is created, rapidly transporting sweat from the skin side to the outer layer for evaporation.

- Moisture vapor transmission can be increased by 20%–40%, while maintaining the quick-drying properties of synthetic fibers.


(V) Environmental Factors


Both moisture vapor transmission testing and actual use are significantly influenced by environmental conditions:


1. Temperature

- Rising temperature: The kinetic energy of water vapor molecules increases, accelerating diffusion; simultaneously, fibers expand after absorbing moisture, enlarging their pores. Moisture vapor transmission rate increases significantly with rising temperature.


2. Relative Humidity

- High-humidity environment: The concentration gradient of water vapor on both sides of the sample decreases, reducing the driving force and lowering the moisture vapor transmission rate.

- Low-humidity environments: The concentration difference is large, resulting in high moisture vapor transmission rates.

- Isothermal and isohygric conditions: When the temperature and humidity on both sides of the sample are identical, the moisture vapor transmission rate is zero.


3. Wind Speed

- Increased wind speed accelerates the loss of water vapor from the sample’s surface, maintaining a higher concentration gradient and thereby increasing the moisture vapor transmission rate.

- In actual outdoor wear, wind speed is a key variable affecting perceived comfort.


IV. Balancing Moisture Permeability with Other Functions


1. Moisture Permeability vs. Water Resistance

Conflict: Water resistance requires extremely small or closed fabric pores, while moisture permeability requires open pores.

Solutions: Microporous membrane technology, hydrophilic non-porous membranes, and high-density weaving techniques (such as high-density fabrics made from ultra-fine fibers).


2. Moisture Permeability vs. Windproofing

Conflict: Windproofing requires a tightly woven fabric structure, while moisture permeability requires unobstructed pores.

Solutions: Multi-layer composite structures, membrane technology, and adding a windproof fabric layer on the outer side of the moisture-permeable membrane.


3. Moisture Permeability vs. Thermal Insulation

Conflict: Thermal insulation requires a layer of still air (loose structure), but excessive thickness reduces moisture permeability.

Solutions: Hollow fibers, 3D knitted structures, and phase-change materials for temperature regulation.


Conclusion


Fabric moisture vapor permeability is a complex system involving multiple interacting factors, spanning disciplines such as fiber science, textile engineering, polymer materials, and heat and moisture transfer.

UTSTESTER provides precise moisture vapor permeability testing equipment. If you encounter any issues during moisture vapor permeability testing, please feel free to contact our technical team at any time.

Water Vapour Permeability Tester


Email: hello@utstesters.com

Direct: + 86 152 6060 5085

Tel: +86-596-7686689

Web: www.utstesters.com

How to choose the best LED work light for your needs

Selecting the best led work light depends on your specific needs and the environment where you plan to work. You should consider brightness, lumens, portability, durability, power source, price, and energy efficiency. Leading brands like Otennlux offer adjustable features.

  • The LED lighting market expects a 5.55% CAGR, reaching USD 145.01 billion by 2031.


Key Takeaways

  • Identify your specific tasks and environment to choose the right LED work light. Different jobs require different lighting solutions.

  • Consider brightness and lumens carefully. For general tasks, look for lights offering 1,000 to 3,000 lumens to ensure visibility and reduce shadows.

  • Use a checklist to compare features like durability, power source, and extra functionalities. This helps you make informed decisions and avoid costly mistakes.


Identify Your Needs for a LED Work Light

Task and Environment

Start by clarifying the main tasks you plan to tackle with your led work light. Different jobs require different lighting solutions. For example, if you work in construction, you need strong site illumination and reliable safety checks. In a workshop, you may focus on general repairs or assembly tasks. Automotive work often involves vehicle inspections, polishing, repairs, and maintenance. The table below highlights common applications:


Application Area

Common Tasks

Construction

Site illumination, safety checks

Workshops

General repairs, assembly tasks

Automotive Work

Vehicle inspections, polishing, repairs, maintenance


Choosing the right led work light for your environment ensures you get the best results and maintain safety.


Indoor vs. Outdoor Use

Consider where you will use your led work light most often. Indoor environments usually offer stable conditions, but outdoor use demands more from your equipment. Outdoor lighting must withstand weather and environmental exposure. You also need to think about light distribution and coverage to avoid dark spots. Safety and wayfinding become crucial outside, especially at night. Outdoor lighting may also need to minimize light spill and consider wildlife or environmental impacts. Select a portable work light with robust build quality for outdoor tasks.


Frequency of Use

Think about how often you will use your led work light. Frequent use requires a durable, high-quality product from a trusted brand like Otennlux. Occasional users may prioritize convenience and portability. If you need the best led work light for daily professional tasks, invest in a model that balances performance and longevity.


Key Features of the Best LED Work Light

waterproof led cnc machine work light


Brightness and Lumens

You need to select the right brightness and lumens for your tasks. The intensity of your led work light determines how well you can see details and avoid shadows. For general use, you should look for models offering 1,000 to 3,000 lumens. Larger areas or specialized tasks require higher lumen outputs. For example, the HELLA S3000 provides 3,000 lumens, while the HELLA S5000 delivers even more. Automotive repairs demand careful consideration of light placement and intensity to minimize shadows and improve visibility. Adjustable brightness levels, such as those found in Otennlux products, allow you to tailor the light output for each task, enhancing both comfort and performance.


Product

Lumen Output

HELLA S3000

3,000 lumens

HELLA S5000

Higher than 3,000


Tip: Adjustable brightness and lumens help you reduce eye strain and improve task accuracy.


Beam Angle and Coverage

Beam angle and coverage play a critical role in how your led work light illuminates your workspace. Narrow beam angles focus light on specific zones, making them ideal for signs or targeted tasks. Wider beam angles provide broad illumination, which is perfect for car parks, warehouses, or large work areas. You should choose the best led work light with a beam angle that matches your environment and task requirements. Wide coverage ensures you avoid dark spots and maintain safety.

  • Narrow beam angles: Focused lighting for detailed tasks.

  • Wide beam angles: Broad illumination for large spaces.


Power Source Options

You must decide between plug-in, rechargeable, or cordless led work light models. Rechargeable led work light options offer flexibility and portability, with runtimes ranging from 3 to over 20 hours on a single charge. Plug-in models provide continuous use, making them suitable for long projects. Cordless led work light designs eliminate the need for cables, improving mobility and reducing clutter. Otennlux integrates energy-efficient technology in their models, ensuring you get reliable performance and lower power consumption.


Type

Runtime on Single Charge

Rechargeable LED

3 to over 20 hours

Plug-in LED

Continuous use


Durability and Build Quality

Durability and build quality are essential for any high-quality led work light. You should look for corrosion-resistant materials that prevent degradation. Sealed housings protect internal components from moisture and dust. Vibration-resistant mounting ensures stability in demanding environments. UV-stable lenses resist yellowing and damage from sunlight, extending the lifespan of your work light. For harsh or wet environments, you need models with IP ratings such as IP65 for basic water protection or IP69K for high-pressure washdowns. These features guarantee long-lasting quality and reliable performance.

  • IP65: Basic water protection.

  • IP69K: High-pressure washdown protection.


Portability and Mounting

Portability is crucial when you move between job sites or need hands-free operation. You can choose from several mounting options:

  • Clip flashlight: Attaches to clothing or bags for short tasks.

  • Headlamp: Mounted on a strap, follows your gaze, ideal for walking or climbing.

  • Magnetic work light: Fixes to steel surfaces, perfect for vehicle repairs or workshop tasks.

These mounting solutions enhance usability and allow you to focus on your work without holding the light.


Extra Features

Extra features add value and convenience to your led work light. USB charging, especially USB-C ports, enables fast recharging. Magnetic bases provide hands-free use in various settings. Some models serve as emergency powerbanks for your devices. Smart features like app control and motion sensors allow you to adjust settings remotely and reduce energy consumption by up to 95%. These innovations improve security and efficiency. Otennlux stands out for integrating advanced features and reliable technology, making their products a top choice for professionals seeking quality and performance.


Feature

Description

USB Charging

USB-C ports for rapid recharging

Magnetic Base

Hands-free use in multiple settings

Emergency Powerbank

Charges devices in emergencies


Note: Smart features such as app control and motion sensors enhance security and reduce energy use.


Compare, Evaluate, and Budget

Feature Checklist

You need a clear checklist to compare led work light options. This approach helps you avoid missing essential features and ensures you select the right model for your tasks. Most users prioritize brightness, durability, and price when making decisions. Consider the following:

  • Brightness: Practical applications range from 300 to 1500 lumens. For typical tasks, 500-800 lumens often suffice.

  • Durability: Look for construction materials like aircraft-grade aluminum and water resistance ratings. These features guarantee long-lasting quality.

  • Price: Seek professional-grade performance at accessible price points.

  • Power source: Decide if you need a rechargeable led work light or a cordless led work light for flexibility.

  • Extra features: USB charging, magnetic bases, and smart controls add convenience.

Tip: Use your checklist to compare models from reputable brands like Otennlux. This step ensures you get reliable performance and advanced features.


Balancing Cost and Value

You must balance cost with essential features and brand reputation. Many buyers make mistakes by focusing only on price or neglecting fixture placement. The table below highlights common errors:


Mistake

Explanation

Underestimating Fixture Quantities

Insufficient fixtures can lead to dark areas and inconsistent lighting, necessitating costly adjustments later.

Ignoring Voltage Drop Calculations

Long wire runs can diminish voltage, impacting the performance of the fixtures. Proper calculations ensure uniform light output.

Choosing Low-Quality Fixtures Based Solely on Price

Inexpensive fixtures may incur higher maintenance and replacement costs over time.

Poor Fixture Placement and Spacing

Incorrect spacing can result in glare and shadows, compromising visibility. Effective design prioritizes uniformity over sheer brightness.

Overlooking Future Maintenance Costs

Clients often neglect long-term costs, where a lower initial bid may not represent the best overall value.


You should use a led work light buying guide to evaluate options. Focus on quality, performance, and long-term value. Otennlux offers models that combine advanced features with durability, helping you avoid costly mistakes and maximize your investment.

You should match LED work light features to your specific needs for the best results. Use a checklist to compare options and make informed choices. Trusted brands like Otennlux lead with high CRI, adjustable color temperature, and ergonomic designs. Assess your requirements, follow a step-by-step approach, and start shopping confidently.


FAQ

What lumen output do you need for most work tasks?

You need 1,000 to 3,000 lumens for general tasks. Choose higher output for large spaces or detailed work.

How do you maintain your LED work light?

Clean the lens with a soft cloth. Store your light in a dry place. Check the battery and connections regularly.

Why choose Otennlux LED work lights?

Otennlux offers advanced features, high durability, and energy efficiency. You get reliable performance for both professional and home use.


Green and Smart Manufacturing A New Trend in the Steel Abrasives Industry

In recent years, the foundry, steel structure, automotive parts and machinery manufacturing industries have continued to upgrade their production requirements. As a result, the surface treatment industry is no longer focused only on cleaning efficiency. More customers are now paying attention to green manufacturing, smart production, stable quality and total cost control.


The foundry industry is moving toward greener, smarter and higher-quality development. Industry studies on China’s foundry sector also highlight that green manufacturing, intelligent production and high-quality development are becoming important directions during the 14th Five-Year Plan period. At the same time, green and intelligent casting also emphasizes digitalization, automation and process stability.


This trend creates higher requirements for the steel abrasives industry. For products such as steel shot, steel grit and cut wire shot, customers are no longer comparing only unit price. They are also looking at abrasive life, breakage rate, dust generation, surface treatment consistency and total operating cost.


Through smart production, standardized inspection and strict quality control, steel abrasive suppliers can help customers improve shot blasting efficiency, reduce abrasive waste and achieve more stable surface preparation results.


Why Has Green Manufacturing Become an Industry Focus?


In shot blasting and abrasive blasting operations, abrasive media not only affects cleaning performance, but also directly influences dust emission, waste generation, equipment wear and energy consumption.


Studies on sustainable blasting media point out that abrasive blasting has long been considered a process with potential exposure risks to respirable crystalline silica, especially when free-silica-containing abrasives are used. Research data also shows that from 2001 to 2010, around 2 million workers in the United States were potentially exposed to respirable crystalline silica, while the recommended exposure limit was only 0.05 mg/m³.


Therefore, low-dust, low-free-silica and recyclable abrasive media, such as Stainless Steel Cut Wire Shot, are becoming increasingly important in the surface treatment industry.


From a sustainability perspective, green abrasives are generally expected to have six key characteristics: zero free silica content, high efficiency, low media consumption, low waste generation, high recyclability and environmental friendliness. This shows that customers are shifting their focus from purchase price to abrasive durability, breakage rate, dust control, waste disposal and total cost of operation.


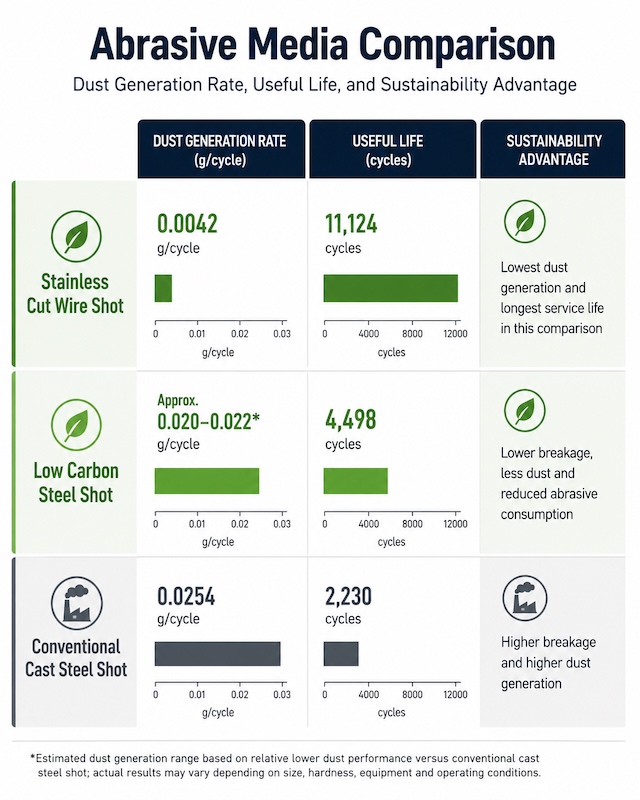
In practical media comparison, different abrasive types can show clear differences in dust generation and useful life under specific test conditions. For example, stainless cut wire shot showed a dust generation rate of 0.0042 g/cycle and a useful life of 11,124 cycles. Low carbon steel shot was estimated at around 0.020–0.022 g/cycle for dust generation, with a useful life of 4,498 cycles. Conventional cast steel shot showed a dust generation rate of 0.0254 g/cycle and a useful life of 2,230 cycles under the same comparative context.


Abrasive Media

Dust Generation Rate

Useful Life

Sustainability Advantage

Stainless Cut Wire Shot

0.0042 g/cycle

11,124 cycles

Lowest dust generation and longest service life in this comparison

Low Carbon Steel Shot

Approx. 0.020–0.022 g/cycle*

4498cycles

Lower breakage, less dust and reduced abrasive consumption

Conventional Cast Steel Shot

0.0254 g/cycle

2230 cycles

Higher breakage and higher dust generation

*Estimated value based on publicly reported 15%–20% lower dust generation compared with conventional high carbon steel shot. Actual dust generation may vary depending on abrasive size, hardness, blasting equipment, impact velocity and working conditions.


These data indicate that abrasives with better durability and lower breakage, including Low Carbon Steel Shot Abrasives, can usually generate less dust, reduce replacement frequency and help lower equipment wear and overall operating cost.


Research on steel shot blasting waste also reported that one metallurgical company generated about 20 tons of steel shot blasting waste per month, which required proper disposal. This further shows that if abrasive media has a high breakage rate and short service life, it can increase waste handling pressure, environmental management cost and long-term operating cost.


As a result, more customers are choosing low-consumption, low-dust, long-life and recyclable metallic abrasives. This is especially important for automatic shot blasting lines, continuous production systems and large-scale foundry cleaning operations, where stable abrasive performance directly affects production efficiency, cost control and green manufacturing performance.


How Does Smart Manufacturing Improve Abrasive Stability?

Smart manufacturing helps steel abrasive manufacturers better control key production stages such as melting, atomization, heat treatment, screening and packaging. For steel shot and steel grit production, stable chemical composition, proper hardness range, uniform particle size distribution and reliable internal microstructure all have a direct impact on final blasting performance.


In steel shot manufacturing, the cooling process is one of the key factors affecting product stability. Compared with traditional water quenching, air quenching can reduce water use in the cooling stage and lower wastewater treatment pressure, making the process more aligned with green and low-carbon manufacturing. At the same time, a stable cooling process can help improve internal structure, reduce the risk of internal defects and enhance abrasive durability and service life.


Smart and mechanized production also helps reduce variations caused by manual operation. It makes melting temperature, alloy composition, heat treatment time, screening accuracy and packaging weight more consistent. For customers, this means that different batches of abrasives can perform more consistently in hardness, particle size, impact behavior and cleaning results.


Standardized inspection is another key factor in abrasive stability. Through chemical composition analysis, hardness testing, particle size inspection, metallographic observation and Ervin life testing, manufacturers can identify batch differences and ensure that abrasive products meet stable quality requirements before entering the customer’s blasting system.


Control Point

Impact on Abrasive Stability

Customer Benefit

Melting Control

More stable chemical composition

Consistent hardness and impact performance

Air Quenching / Air Cooling

Reduced water use and more stable cooling process

Lower wastewater pressure and improved durability

Heat Treatment Control

Better hardness and toughness balance

Lower breakage and longer service life

Screening & Classification

More uniform particle size distribution

More consistent blasting results

Standardized Inspection

Batch quality verification

More reliable supply and fewer quality variations


Therefore, smart manufacturing is not only about automation. More importantly, it uses process control, green cooling technology, standardized inspection and batch traceability to reduce product variation and improve abrasive consistency. For automatic shot blasting lines, continuous production lines and large-scale casting cleaning, stable abrasive performance can help reduce breakage, dust generation and abrasive consumption while improving surface treatment consistency.


How Zhongxing Metal Responds to Industry Trends

Facing the trends of green manufacturing and smart production, Shandong Zhongxing Metal Products Co., Ltd. continues to upgrade its production capacity, quality control, environmental process and standardized management. The goal is to provide customers with more stable, reliable and sustainable steel abrasive solutions.


In terms of manufacturing capability, Zhongxing Metal continues to invest in intelligent production. On May 1, 2026, the company put a new intelligent mechanized melting production line into operation, with a total investment of RMB 50 million. After the new line is launched, the company’s annual production capacity will increase to 200,000 tons, with an estimated annual output value of RMB 800 million. This upgrade further strengthens the company’s large-scale production and stable delivery capability for steel shot, steel grit and other metallic abrasives.


In terms of production systems, Zhongxing Metal is equipped with medium-frequency induction furnaces, continuous drying lines, continuous quenching and tempering lines, steel grit crushing and screening lines, automatic weighing and packing systems, wire cutting machines and conditioning equipment. According to company information, the monthly capacity reaches approximately 6,000 MT for steel shot and steel grit, and approximately 3,000 MT for cut wire shot and Conditioned Cut Wire Shot Media. These facilities support continuous production, precise particle size control and stable product performance.


In green manufacturing, Zhongxing Metal integrates environmental considerations into raw material selection, process optimization, energy saving and recycling. The company uses high-quality steel scrap and alloy materials as raw materials, and controls product consistency through melting, atomization, screening, heat treatment and inspection. Metallic abrasives are reusable and recyclable, helping customers reduce waste generation and lower long-term operating cost.


In quality assurance, Zhongxing Metal has established a complete testing system. Each batch of products is inspected for chemical composition and physical performance. The company is equipped with testing instruments such as spectrometer, infrared carbon and sulfur analyzer, elemental analyzer, metallurgical microscope, hardness tester, Ervin life testing machine, sample mounting and polishing equipment. These instruments help control key indicators such as chemical composition, hardness, microstructure, particle size and abrasive life.


Zhongxing Metal has also obtained ISO 9001 Quality Management System, ISO 14001 Environmental Management System and ISO 45001 Occupational Health and Safety Management System certifications. The certification scope covers the production of metal abrasives, including steel shot, steel grit, alloy shot and cut wire shot. These certifications provide important support for international buyers when evaluating supplier reliability, quality consistency, environmental management and long-term cooperation capability.


In the future, competition in the steel abrasives industry will not be based only on price. It will increasingly depend on production capacity, quality stability, delivery capability, technical service and sustainable manufacturing. Zhongxing Metal will continue to support global customers through smart manufacturing, standardized inspection and green production, helping them improve shot blasting efficiency, reduce abrasive consumption and achieve more stable surface treatment results.


References

1. Xu G. Digital and Intelligent Green Casting System for Aluminum Alloy Low-Pressure Metal Mold CastingFoundry, 2019, 68(4): 347–352. 

2. Zulkarnain I., Kassim N. A. M., Syakir M. I., Rahman A. A., Yusuff M. S. M., Yusop R. M., Keat N. O. Sustainability-Based Characteristics of Abrasives in Blasting IndustrySustainability, 2021, 13(15): 8130. DOI: 10.3390/su13158130. 

3. Lermen R. T., Prauchner M. B., Silva R. A., Bonsembiante F. T. Using Wastes from the Process of Blasting with Steel Shot to Make a Radiation Shield in MortarSustainability, 2020, 12(16): 6674. DOI: 10.3390/su12166674. 

4. Shot Peener Library. Shot Peening Media — Its Effect on Process Consistency. Technical reference document.

How Can Steel Grit Improve Surface Roughness Before Coating?

Surface roughness is one of the most important factors in coating performance. Before painting, powder coating or protective coating, metal surfaces usually need to be cleaned and roughened to create a suitable surface profile. This profile helps the coating bond more strongly to the substrate and improves long-term corrosion protection.


Steel grit, particularly Cast Steel Grit for Surface Preparation, is one of the most effective abrasive media for this process. Because of its angular shape and strong cutting ability, steel grit can remove rust, mill scale and old coatings while creating a controlled rough surface for better coating adhesion.


1. Why Surface Roughness Matters Before Coating

A coating does not perform well on a surface that is too smooth, contaminated or covered with rust and oxide scale. If the surface profile is not suitable, the coating may have poor adhesion, uneven thickness, premature peeling or reduced corrosion resistance.


Proper surface roughness helps create a mechanical anchor pattern. This allows the coating to grip the metal surface more effectively. For steel structures, tanks, pipes, machinery parts and heavy-duty components, a stable surface profile is essential for coating durability.


However, roughness must be controlled. If the surface is too smooth, coating adhesion may be weak. If the surface is too rough, it may require more coating material and increase the risk of uneven coverage. That is why abrasive selection is important.


2. How Can Steel Grit Improve Surface Roughness Before Coating?

Surface roughness is an important factor in coating performance. Before painting, powder coating or anti-corrosion coating, metal surfaces need to be cleaned and roughened to create a suitable surface profile for better coating adhesion.


Steel grit, acting as an excellent Abrasive Steel Grit for Rust Removal, is effective for this process because its angular shape and strong cutting action can remove rust, mill scale and old coatings while creating a controlled rough surface. In surface preparation, ISO 8501 is used to evaluate surface cleanliness after blast cleaning, while ISO 8503 is used to assess the surface profile or roughness before coating. The goal is not simply to make the surface rougher, but to achieve the right balance between cleanliness, surface profile and coating requirements.


ISO 8501 focuses on visual cleanliness. It helps determine whether the steel surface has been cleaned to the required preparation grade before coating.


ISO 8501: Surface Cleanliness After Blast Cleaning

ISO 8501 Preparation Grade

Meaning

Typical Use Before Coating

Sa 1

Light blast cleaning

Removes loose rust, loose mill scale and loose contaminants. Usually used for low-demand cleaning.

Sa 2

Thorough blast cleaning

Removes most mill scale, rust and foreign matter. Suitable for general industrial surface preparation.

Sa 2½

Very thorough blast cleaning

Removes visible oil, grease, dirt, mill scale, rust and old coatings. Any remaining traces should only appear as slight stains or strips. Commonly used for industrial protective coating.

Sa 3

Blast cleaning to visually clean steel

Surface is cleaned to a uniform metallic appearance. Used for high-performance coating systems or demanding anti-corrosion applications.


For many steel structure, tank, pipeline and heavy-duty coating applications, Sa 2½ is commonly required. For more demanding corrosion protection, Sa 3 may be specified.


ISO 8503: Surface Roughness and Surface Profile

After the surface reaches the required cleanliness level, the next question is whether the surface profile is suitable for coating adhesion. This is where ISO 8503 becomes important. ISO 8503 evaluates the roughness characteristics of blast-cleaned steel substrates. In practical inspection, ISO surface profile comparators can be used to visually and tactilely compare the blasted surface and classify the profile grade.

ISO 8503 Surface Profile Grade

General Meaning

Relationship with Steel Grit Blasting

Fine Profile

Relatively shallow surface profile

Suitable for thinner coating systems or applications where excessive roughness should be avoided.

Medium Profile

Moderate and controlled surface profile

Commonly used for many industrial coating and anti-corrosion applications.

Coarse Profile

Deeper surface profile

Suitable for heavy-duty coating systems, thick coatings or surfaces requiring stronger mechanical adhesion.


When steel grit is used for surface preparation, the surface profile is usually angular because steel grit cuts into the surface and creates sharp peaks and valleys. This profile can improve mechanical bonding between the coating and the steel substrate.


Typical Surface Profile Reference After Steel Grit Blasting

Surface Profile Requirement

Approximate Profile Range

Suitable Application

Steel Grit Selection Direction

Fine Profile

25–50 μm

Thin coatings, light surface preparation, components requiring moderate roughness

Finer steel grit

Medium Profile

50–85 μm

General protective coating, steel structures, machinery parts, tanks and pipelines

Medium steel grit, commonly used for coating preparation

Coarse Profile

85–120 μm or higher

Heavy-duty anti-corrosion coating, severe rust removal, thick coating systems

Coarser steel grit or harder grit depending on project requirements


A surface that is too smooth may reduce coating adhesion. A surface that is too rough may increase coating consumption and create uneven coverage. Therefore, the correct roughness should always match the coating supplier’s technical specification, project standard and customer requirement.


Why Steel Grit Is Effective for Controlled Surface Roughness

Compared with round steel shot, steel grit has an angular shape and stronger cutting ability. During blasting, steel grit removes rust, mill scale and old coatings while creating a roughened anchor profile on the metal surface.

This helps achieve three important results:

1. The surface becomes cleaner and better prepared for coating.

2. The coating can bond more strongly through mechanical anchoring.

3. A controlled surface profile can improve coating consistency and long-term corrosion protection.


For coating preparation, steel grit is especially suitable for steel structures, bridges, tanks, pipelines, shipbuilding, machinery parts and other applications where surface profile and coating adhesion are critical.


3.  Steel Grit vs Steel Shot Before Coating

Steel shot and steel grit are both metallic abrasives, but they create different surface effects.


Steel shot is spherical. It mainly cleans the surface through impact and produces a smoother finish. It is suitable for general cleaning, desanding and applications where a less aggressive surface is required.


Steel grit is angular. It cuts the surface more aggressively and creates a stronger surface profile. This makes it more suitable for coating preparation, heavy rust removal, mill scale removal and applications that require better coating adhesion.


For customers who need a clean and rough surface before coating, an Angular Steel Grit for Coating is usually the preferred option.


How to Choose the Right Steel Grit?

Different coating systems and workpieces require different surface profiles. Choosing the right steel grit requires consideration of the workpiece material, surface condition, coating requirement, blasting equipment and required roughness.


In steel grit selection, SAE J444 is commonly used as a reference standard for cast steel shot and steel grit size classification. This standard defines common grit size numbers such as G10, G12, G14, G16, G18, G25, G40, G50 and G80. These grit size numbers help users select suitable abrasive media according to the required cleaning strength and surface profile.


In general, coarser steel grit can create a deeper surface profile and stronger cutting effect, making it suitable for heavy rust removal, thick mill scale removal and large steel structure preparation. Finer steel grit can create a more moderate and uniform profile, making it suitable for thinner coatings, smaller parts or applications where excessive roughness should be avoided.


Steel Grit Size Reference Grit Characteristics Surface Treatment Effect Suitable Applications

Steel Grit Size Reference

Grit Characteristics

Surface Treatment Effect

Suitable Applications

G10 / G12 / G14 / G16 / G18

Coarser steel grit

Creates a deeper surface profile with stronger cutting action

Heavy rust removal, thick mill scale removal, large steel structures, heavy-duty coating preparation

G25 / G40

Medium steel grit

Provides a balanced surface profile, combining cleaning efficiency and coating adhesion

General coating preparation, steel structures, machinery parts, anti-corrosion surface preparation

G50 / G80

Finer steel grit

Creates a finer and more uniform surface profile

Thin coatings, small workpieces, light surface preparation, applications where excessive roughness should be avoided


However, grit size is not the only factor that determines the final surface roughness. Steel grit hardness, blasting pressure, wheel speed, impact angle, substrate hardness and initial surface condition can all influence the final surface profile. Therefore, SAE J444 can help guide steel grit size selection, but the actual surface roughness should still be verified according to the coating specification and project requirements.


Influencing Factor

Impact on Surface Roughness

Steel Grit Size

Coarser grit usually creates a deeper profile, while finer grit creates a more uniform and shallower profile

Steel Grit Hardness

Higher hardness provides stronger cutting ability and faster profile creation

Blasting Pressure / Wheel Speed

Higher impact energy usually increases cleaning intensity and surface roughness

Impact Angle

Different impact angles affect cutting action and surface profile shape

Substrate Hardness

Harder substrates may require higher impact energy or a more suitable grit size to achieve the required profile

Initial Surface Condition

Rust, mill scale and old coating thickness affect cleaning efficiency and final surface results


Steel grit hardness is also important. Harder grit can provide stronger cutting performance and create the surface profile more quickly, while softer grit may be more suitable for less aggressive cleaning and longer media life under certain working conditions.


A suitable steel grit should help customers balance cleaning speed, surface profile, coating consumption and total blasting cost. The goal is not simply to choose the coarsest or hardest grit, but to select the right grit size and hardness according to the required surface preparation result.


4. How Zhongxing Metal Supports Surface Preparation

Shandong Zhongxing Metal Products Co., Ltd. provides steel grit for surface preparation, rust removal, descaling and coating preparation applications. Our steel grit is designed to support strong cutting performance, controlled surface roughness and stable blasting results.


We offer different steel grit sizes and hardness options to match various customer requirements. According to the workpiece material, surface condition, coating specification and blasting equipment, we can help recommend suitable abrasive media for practical production needs.


For customers in steel structures, foundries, machinery manufacturing, shipbuilding and surface treatment industries, choosing the right steel grit can help improve blasting efficiency, coating adhesion and overall surface preparation quality.


With stable product quality, reliable supply capability and professional technical support, Zhongxing Metal has established long-term cooperation with many domestic and international shipyards, steel structure companies, foundries and machinery manufacturers. Shipbuilding and heavy-duty anti-corrosion coating applications require strict surface preparation quality, where grit size consistency, hardness control, cutting performance and durability directly affect blasting efficiency, surface profile and coating adhesion.


Through controlled production and strict quality inspection, Zhongxing Metal focuses on product consistency and batch stability. Our steel grit products have gained recognition from customers in both domestic and overseas markets for stable cleaning results, controlled surface roughness and reliable performance in continuous blasting operations.


In the future, Zhongxing Metal will continue to provide reliable steel grit solutions for shipbuilding, steel structures, bridge construction, foundries, machinery manufacturing and industrial surface treatment, helping customers improve blasting efficiency, coating adhesion and total surface preparation cost control.